suspended growth (activated sludge) process
Reading time:presentation and background
This process was probably born on Friday, the 3rd of April 1914 when two English researchers, Edward Ardern and William Lockett, submitted a report to the Industrial Chemicals Society in London on their work under the title "Experiments on sewer water oxidation without the use of filters".
Activated treatment plants mainly comprise (figure 8):

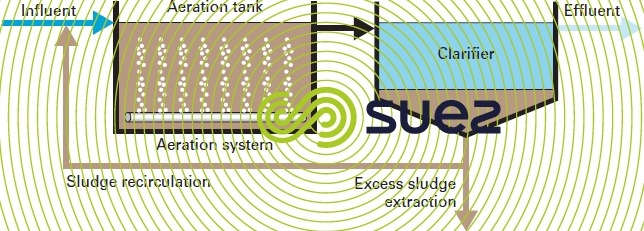

- an aeration tank where the water to be purified is brought into contact with the purifying bacteria mass;
- a clarifier where the purified water is separated from the bacterial culture;
- a recirculation arrangement used to return biological sludge collected from the clarifier to the aeration tank;
- an excess sludge (i.e. the excess bacterial culture synthesised from the substrate) extraction and removal arrangement;
- a mechanism for supplying oxygen;
- a mixing arrangement for this tank in order to ensure the best possible contact between the bacteria cells and their nutrient, to encourage the widespread diffusion of oxygen to those areas requiring oxygen and to prevent the formation of deposits. Quite frequently, the same arrangement is used for aeration and mixing.
In the so-called "sequential batch reactor" (SBR), the various stages: aeration – sedimentation are carried out in batches in the same structure which is first aerated and mixed and then not aerated and, therefore, in sedimentation mode. Therefore, this is just a variation on the activated sludge system. A detailed description of this particular technology can be found in the section sequencing batch reactor process.
A water treatment plant using the activated sludge system can initially be identified by its F/M ratio (expressed in kg of BOD5.kg-1 VM.d-1) and it is this ratio that is used to classify the different processes (see page 2 for a biological reactor table 4).
Up until the end of the Second World War, water treatment plant dimensioning remained very careful. It is only after this date that we saw the development of high load systems and the used of combined tanks (e.g. Aeroaccelator, Oxyrapid), the "Biosorption or Contact stabilisation" processes… that significantly reduce investment costs but to the detriment of ease of operation and of effluent quality.
At the present moment, the search for high purification performances and the need to eliminate nitrogen and phosphorus are renewing interest in low loading treatment systems. However, before describing these treatments, figure 9 provides a schematic diagram of a complete activated sludge water treatment plant handling carbon, nitrogen and phosphorus.
This diagram defines the main parameters and their notation as they affect the dimensioning and operation of the plant and highlights the links between these aspects. Further on, we shall be using the notations found in this figure.

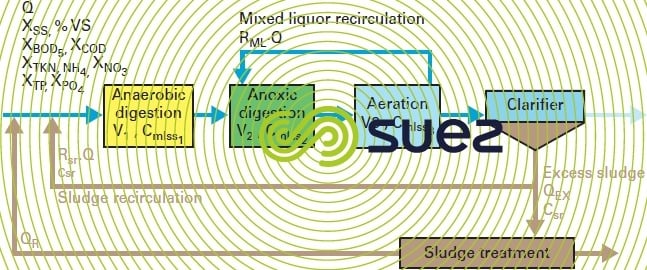

influent/effluent
Q, incoming flow and discharge flow (often called the through flow) (in m3 · d–1) and Qr return flow from the sludge treatment outlet.
Pollutant concentrations (X incoming, Z discharged):
XSS, suspended solids concentration in the water: (a small proportion of suspended solids will be inert or absorbed without any deterioration of the bacterial floc).

biological reactor
V1, V2, V3, volume of the different tanks bmlss1, bmlss2, bmlss3 (in m3)
The schematic diagram shows the Anaerobic + Anoxic + Aeration configuration for treating carbon, nitrogen and phosphorus.
An anoxic and aeration configuration is only appropriate to C and N treatment. Please refer to the various diagrams shown under Chapter 11.Biological processes for an overview of all possible N/DN configurations.
Only an aeration tank will be required for a carbon only treatment.
Cmlss1, Cmlss2, Cmlss3, concentration of MLSS (mixed liquor) in the tanks concerned (in g · L–1)
In this case, we have Cmlss1 = Cmlss2 = Cmlss3
In step-feed configurations or membrane reactors, there will be different concentration levels in each tank.
Cvs, biomass (VS) concentration in the tanks concerned (in g · L–1).
F/M ratio, Cm, usually expressed as kg BOD5 · kg–1 Suspended Solids · d–1 or kg BOD5 · kg–1VS · d–1


BOD loading, BODL usually expressed as kg BOD5 · m–3


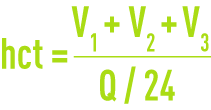
Hydraulic contact time, hct, applicable to water in the tanks (in hours)

Aerated sludge age, A, or the average time spent by sludge in aeration (in days)

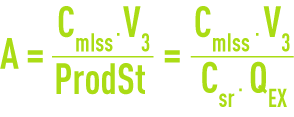
In order to ensure that nitrification takes place, A must by greater than a minimum duration that is temperature-related.
Average sludge contact time, tsc or At, total sludge age (in days)


Mixed liquor recirculation rate in anoxic conditions, RML (as a %) in the denitrification configuration.
Denitrification performance, ρDN
In the anoxia-aeration scheme, the treated water concentration ZNO3 will be identical to the concentration recirculated by mixed liquors and by sludge. If we assume that the anoxia zone dimensioning will allow us to denitrify all recirculated nitrates, we will achieve maximum denitrification efficiency.


if RML = 200 % and Rsr = 100 %, then ρDN maximum possible = 75 %
clarifier
Rsr, sludge recirculation rate (in %)
If Q · Rsr, recirculated sludge flow rate (m3 · d–1)
Csr, concentration applicable to sludge extracted from the clarifier


QEX, excess sludge output (m3 · d–1)
The following should be noted: a low QEX before Q · Rsr
treated water
Q, treated water output if we ignore QEX
ZSS in mg · L–1, usually between 10 and 30 mg · L–1
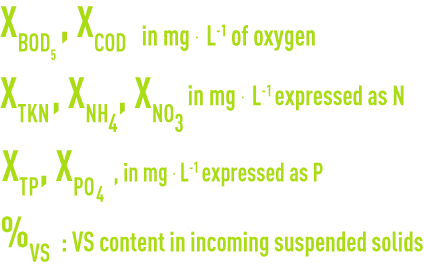
ZBOD5, ZCOD in mg · L–1 of oxygen
ZTKN, ZNH4, ZNO3 in mg · L–1 expressed as N
ZTP, ZPO4 in mg · L–1 expressed as P
sludge treatment
QR, the sludge return output from the sludge treatment system (in m³ . d-1) containing suspended solids, BOD5, COD, HN4, NO3, P pollution that has to be allowed for as additional pollution at the biological or primary sedimentation inlet.
basic relations used for carbonaceous pollution removal
These relations lead to the use of characteristic coefficients that depend on the nature of the substrate and on the physiological condition of the biomass as established mainly by the age of total sludge or of aerated sludge only.
oxygen requirements and excess sludge production
When the biodegradable organic matter has been consumed by a mass of micro-organisms in an aerobic medium, we have:
- on the one hand, the oxygen consumed by these micro-organisms for their energy requirements, their reproduction by cell division (synthesising living matter) and their endogenous respiration (auto-oxidising of their cell mass);
- on the other, the production of excess living matter and inert matter designated excess sludge.
It is difficult to ascertain the active concentration CamIss in active sludge through experimentation; however, we can measure volatile matter concentration Cvs and total MLSS (mineraland organic) concentration) CmIss.
As an illustration of these different phenomena, we can use the example of the breakdown of a totally biodegradable molecule, glucose. During a first stage, glucose is converted through additional nitrogen that is assimilated into the cell protein and where the overall formula will be assimilated to C5H7O2N.
The second stage sees this protein being broken down within the cell to produce maintenance energy.Both reactions can be written schematically as follows:
- Synthesis


- Auto-oxidation or endogenous respiration


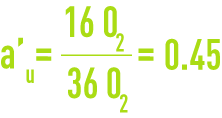
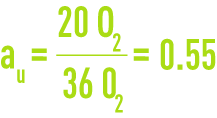
In the preceding example, the complete oxidation of the six glucose molecules therefore required 36 molecules of oxygen. These 36 molecules relate to the six glucose molecule COD, or even to their ultimate BOD. Of the 36 oxygen molecules, 16 are used for synthesis and 20 for endogenous respiration.
au is the fraction of ultimate BOD used for synthesis

au is the fraction of ultimate BOD used for the complete oxidation of living matter

The mass of cells formed by the ultimate mass of BOD eliminated parameter, aum, can be likened to a cellular efficiency. In the preceding case:

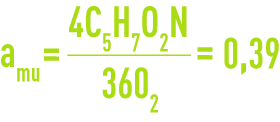
Therefore, to break down 1 g of ultimate BOD, we need to synthesise 0.39 g of living matter.
use in establishing oxygen requirements
There are two types of oxygen requirements:
- bacteria synthesis requirements. These requirements can be expressed as follows:


- endogenous respiration requirements
We have seen that within a water treatment plant, not all the mass of synthesized bacteria will be oxidised as CO2 and H2O. Only a fraction bu of the 4C5H7NO2 synthesised will be converted into CO2 and H2O.In other words, only a fraction b’u of the 20 O2 required for the complete oxidation of living matter needs to be supplied.


Total requirements will, therefore, be equal to a’u · ultimate BOD eliminated + b’u · mass of living matter.
For calculation purposes, these oxygen requirements will be expressed in kg per day or per hour (peak).
For ease of calculation, the following values are normally used:
- a' for BOD5 and not for ultimate BOD;
- b' for the volatile matter mass (sometimes even the total matter) and not that of the living matter.
use in determining excess sludge production
As already discussed, biological sludge production relies on two factors:
- biomass production when synthesis reactions take place;
- consumption of a proportion of this biomass when endogenous respiration reactions take place.
The biomass produced during synthesis can be expressed as: am x BODu eliminated.
For its part, endogenous respiration consumes: b x mass of VS.
Therefore, the overall breakdown can be expressed as follows:


This sludge production is expressed as kg of suspended solids per day. To this sludge, we have to add the quantity of non-biodegradable, mineral (Sm) and volatile (Svi) suspended solids contained in the raw effluent and trapped in the biological floc. This quantity can account for a large proportion of the total excess sludge output, especially when the raw water has a high suspended solids/BOD5 ratio.
Consequently, the following formula is used to express overall production of excess sludge:


To this excess sludge production, we need to add autotrophic sludge in the event of nitrification and physical-chemical sludge in the event of simultaneous chemical phosphorus removal.
For ease of use, the coefficient am is expressed in relation to BOD5 (and not ultimate BOD) and coefficient b is expressed in relation to volatile matter (and not living matter).
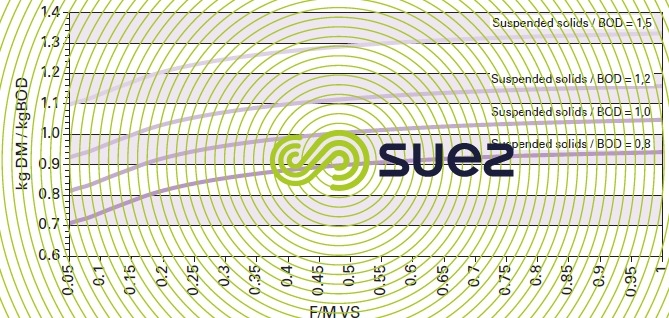
In UWW biological purification applications, the curves shown in figure 10 provide a rough approximation of biological sludge production by a system at a temperature close to 15°C, based and F/M r SS / BOD ratios.


operating parameters for a biological reactor
Of a plant’s operating parameters as detailed in figure 9, four are crucial: F/M ratio, sludge age, sludge volume index and aeration.
F/M ratio
The F/M ratio refers to the mass of nutrients entering into the reactor each day compared with the mass of sludge present in the same reactor. It is usually expressed as kg BOD5·kg–1VM·d–1.
In activated sludge, the F/M ratio conditions:
- its purification performance; low F/M ratios are found with high purification levels and high F/M ratios with lower purification levels;
- production of excess biological sludge; at low loads, because endogenous respiration is greater than at high loads due to substrate limitations, the ensuing biomass output will be lower;
- the extent of stabilisation in the excess sludge produced; thorough endogenous respiration will produce a thoroughly "mineralised" biomass and a characteristic of low load processes is the production of excess sludge that is less liable to ferment;
- oxygen requirements in respect of the pollution eliminated; the importance of low load endogenous respiration results in oxygen consumption levels, in respect of the pollution eliminated, that are higher than those achieved under high load conditions.
Another load concept is often used: BOD loading. BOD loading is the mass of nutrients that enters daily per reactor unit of volume.
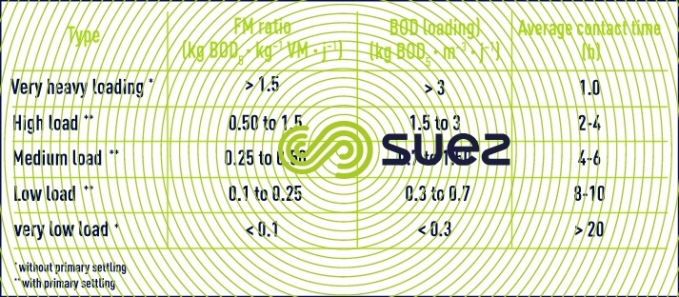
It is customary to classify the various processes using activated sludge according to their operating F/M ratio or BOD loading (table 4).


sludge age
Total sludge age At (or SRT) is the ratio between the sludge mass present in the reactor and the daily sludge mass produced by the plant.
The daily excess biological sludge output has been indicated in the section suspended growth (activated sludge) process.
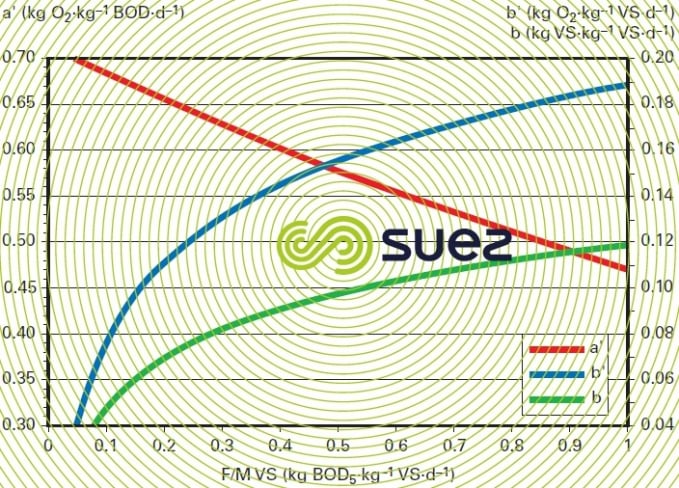
Therefore, the age of the sludge will be in inverse proportion to the F/M ratio. This concept of sludge age is particularly important because it is indicative of the physiological condition of the micro-organisms: the respiratory coefficients a’ and b’ examined above are closely correlated to the age of the sludge (figure 11). Furthermore, the presence or absence of nitrifying germs will be conditional on sludge age (see suspended growth (activated sludge) process).


sludge settling capability
Satisfactory activated sludge plant operation depends on satisfactory aeration tank operation and also on that of the clarifier. If the clarifier is to be able to efficiently separate the biomass from the treated water, this biomass must be properly flocculated.
Under certain conditions, micro-organisms have the property of being able to come together in floc. This is called bioflocculation.
During the exponential growth phase, bacteria remain dispersed throughout the culture medium. As the bacteria transit to the slow phase, they come together to form brownish flakes with frayed edges that normally reach several millimetres in size.
Seen under the microscope, they often take on a branched "glove finger" appearance. This is where bacteria appear, enveloped in gelatinous looking substances. The floc persists in the endogenous metabolism phase. However, if we monitor the change in percentage of free organisms, those that are not bound into the floc, depending on the age of the sludge, we will see that the minimum percentage will occur within a range of between one and two days. Beyond the twenty days, although overall sedimentation capability remains good, we can see the beginning of deflocculation that is visible as a shrinking floc size and an increase in the number of small particles escaping from this floc (pinpoint floc).
Conversely, in under one day, an extremely hydrophyllic floc will settle less easily and the number of free micro-organisms will proliferate very fast.
Bioflocculation is an extremely complex phenomenon. At present, it is quite clear that:
- it is regulated by the physiological condition of the cells;
- it is not the privilege of one single species but concerns a behaviour that is quite widespread throughout the realm of common microflora;
- the main effect is linked to the excretion of polymers of which polysaccharides play a special part.
A simple and practical method for assessing a sludge’s sedimentation capability consists in determining its sludge volume index (SVI) (see different types of sedimentation).
aeration
Oxygen is injected into water through a close contact between air dispersed as bubbles within the liquid on the one hand and water on the other. Where two fluids interface, the boundary layer becomes oxygen-saturated as soon as it forms while gases begin to diffuse towards the furthermost layers of water.
The quantity of oxygen diffused per unit of time will be


KLa is the transfer coefficient (see theoretical bases for gas/liquid exchanges).
Starting from this equation, we can establish the oxygenation capacity (OX.CAP.) of an aeration system as being the quantity of oxygen expressed in g · m–3 supplied to pure water over one hour, at a constant and zero oxygen content, a temperature of 20°C and an atmospheric pressure of 1 bar.
The extent of the transfer will depend on:
- the size of the interface surface separating water and air, and this surface renewal and, therefore, bubble size and turbulence;
- the oxygen gradient between the air and the water (Dc);
- the time available for oxygen diffusion.
However, the optimum figures applicable under these conditions continue to be subject to physical-technical limits.
All other aspects being equal, the oxygen transfer coefficient KLa will depend on:
- the nature of the water (clean water or wastewater containing suspended or dissolved matter including surfactants;
- the aeration system used;
- the reactor’s geometry.
Bubble size will depend on the aeration system selected (see biological processes). This size does have a lower limit because the bubble delivered from an underwater opening will have a diameter that is markedly larger than that of the pore or slot delivering the bubble: in practice, the diameter of bubbles formed by porous units or aerating membranes will measure approximately one millimetre. Finer bubbles can only be obtained by expanding water that is saturated with pressurised air (process used in flotation). This process is far too expensive for use in aerating activated sludge. Mechanical devices usually produce larger bubbles than porous or membrane systems.
As a rule, aeration systems are compared on the basis of their oxygenation capacity (kg of O2 transferred per m³ of pure water and per hour); a system’s specific transfer capacity can also be expressed by the quantity of oxygen delivered for each kWh used.
The biological processes section provides the calculations required to determine this (OX.CAP.) according to the site (temperature – altitude), the equipment (aerator type, tank depth…) and the processes selected.
Bookmark tool
Click on the bookmark tool, highlight the last read paragraph to continue your reading later


