


statistics
Reading time:The symbol (–) placed above an expression signifies that its mean value applies.
definitions
sum


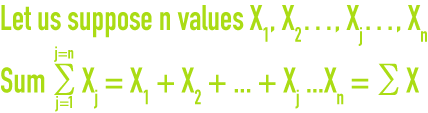
arithmetic mean

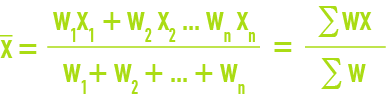
weighted arithmetic mean
mediane
The median for a series of numbers arranged by increasing value is the middle value, or the arithmetic mean of the two central values (when there is an even number of values).
mode
The mode of a series of numbers is the number most frequently encountered, i.e. the one that has the greatest frequency. The mode may not exist or it may not be unique.
Empirical relation between the mean, the median and the mode (figure 1) :
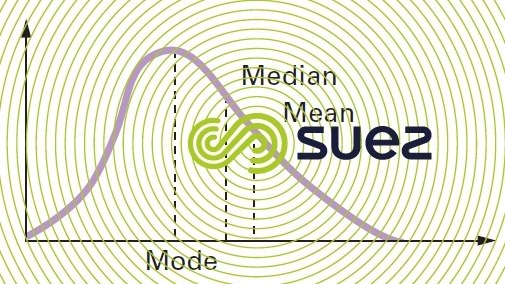
The following empirical relation applies to moderately asymmetrical unimodal density curves :

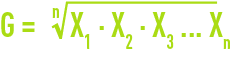
geometric mean G :
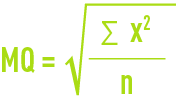
quadatic mean QM :
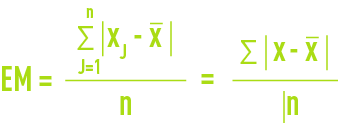
average deviation AD :
standard deviation SD
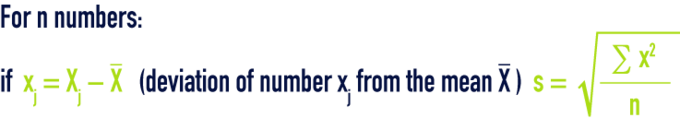
variance V

property of the type deviation
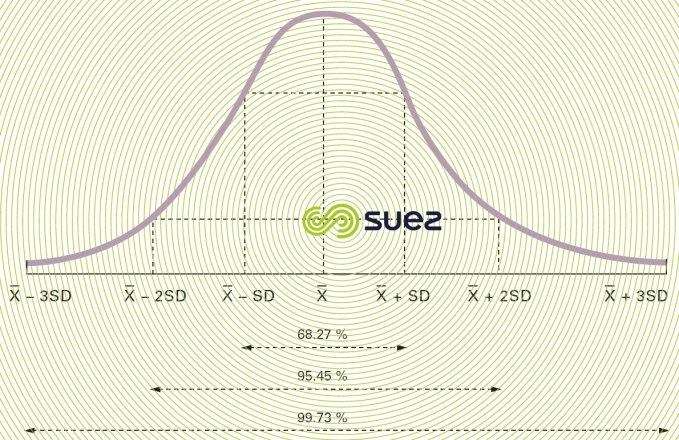
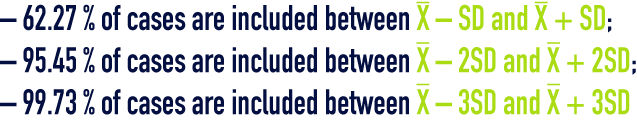
In the case of a normal distribution or of a Laplace-Gauss distribution (figure 2), it would seem that :

graphic method for adjusting a curve
Using a scatter chart (figure 3), it is often possible to represent a continuous curve that is close to the data. This type of curve is called an adjustment curve.
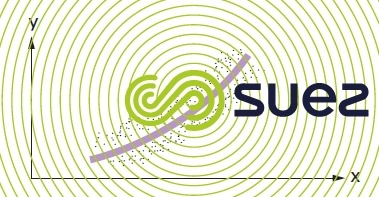
The most classic method is the least squares method.
definition
Among all the curves that are close to a series of data, the one that provides the best match is the one that confirms the following property :

D1, D2, DN being the distances between the curve and the experimental points (figure 4).
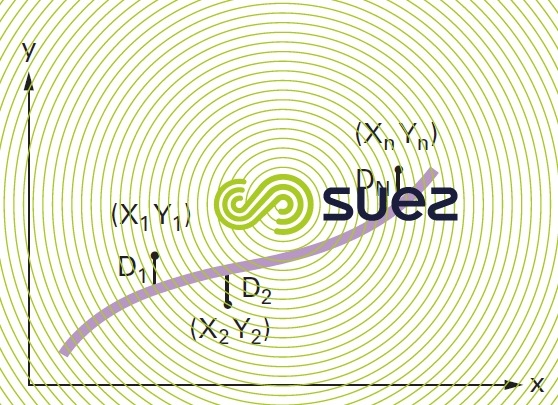
This is called the curve of the least squares.
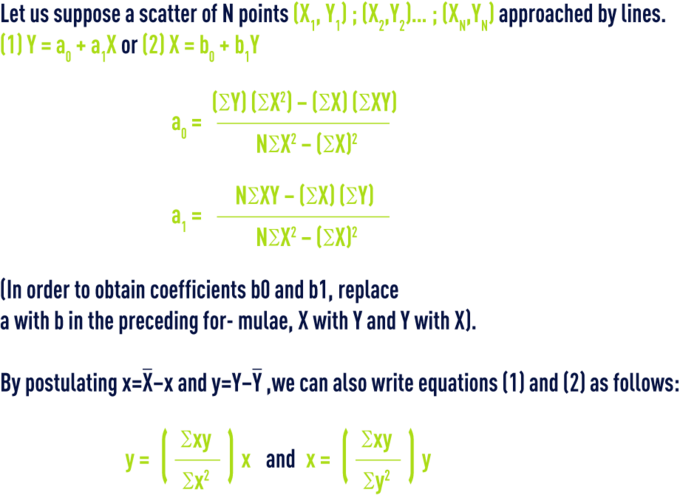
regression line of the least squares
Bookmark tool
Click on the bookmark tool, highlight the last read paragraph to continue your reading later
